The Campaign represents a new way of working together across Georgia, across sectors, across agencies and organizations, and across the early years and early grades. We use data to identify patterns that point to underlying factors affecting language and literacy outcomes in order to find clues that lead to new—and sometimes unexpected—solutions.
These tools developed for the Campaign can help state and local leaders understand and address the challenges our children are facing on the path to literacy.
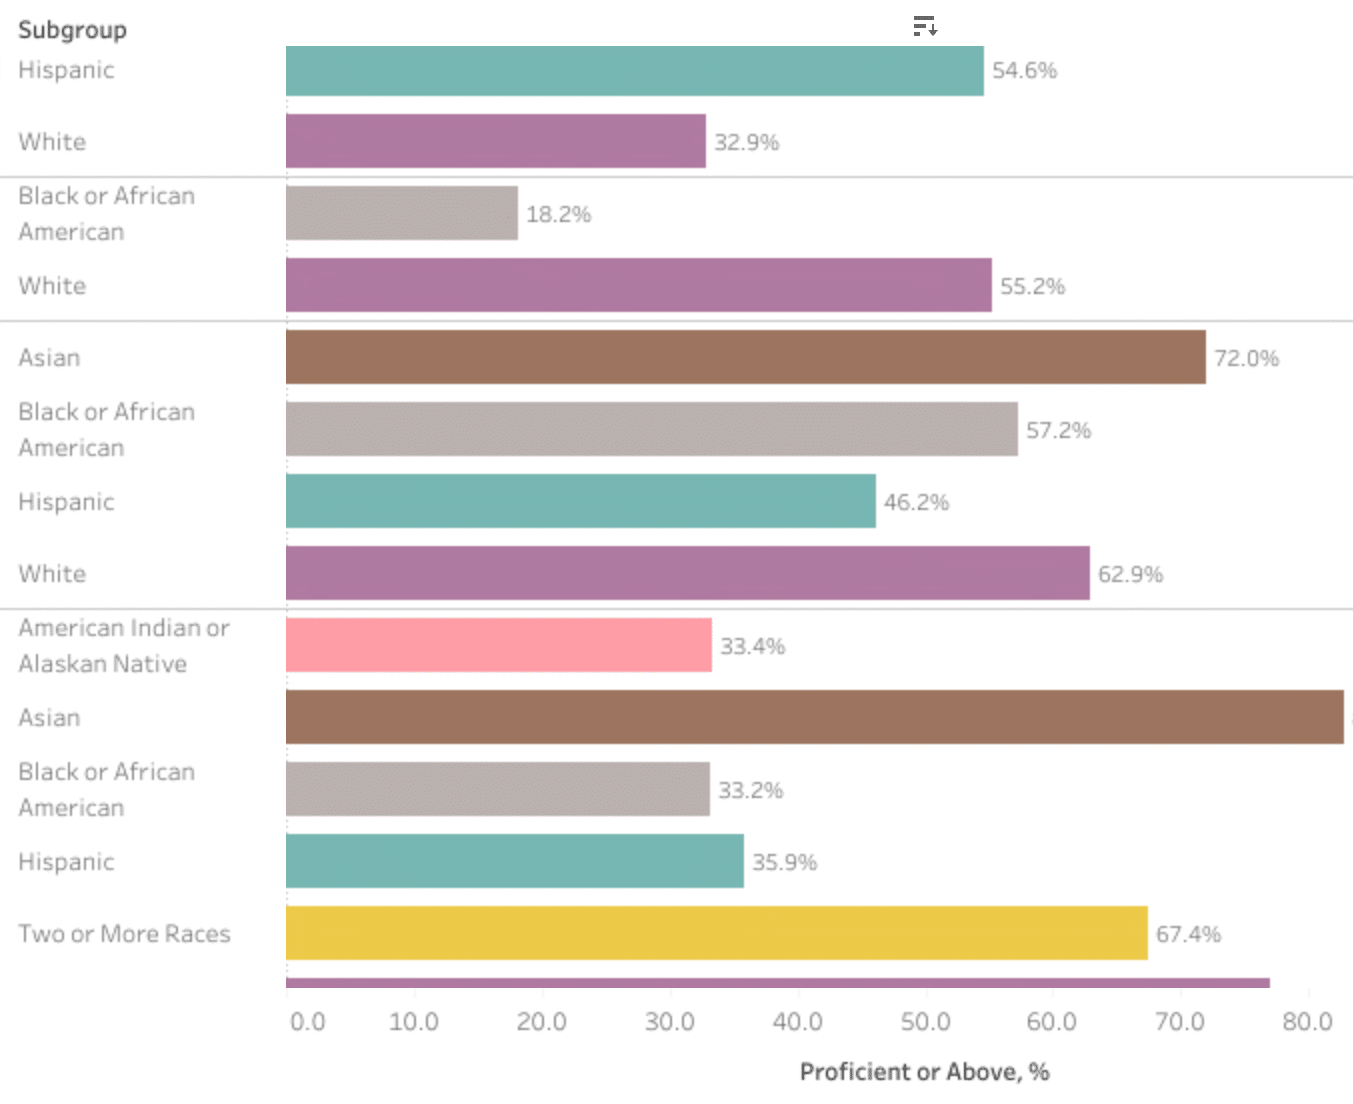
Georgia Student Achievement Dashboard: Find out how elementary school children are faring in English language arts and math. Choose one school or school district or look statewide to see what percentage of students are scoring proficient and above on state assessments in third and fifth grades. Sort data by disability status, economic status, English proficiency, gender, migrant status, and race/ethnicity. Examine trends in scores with data available back to 2015.
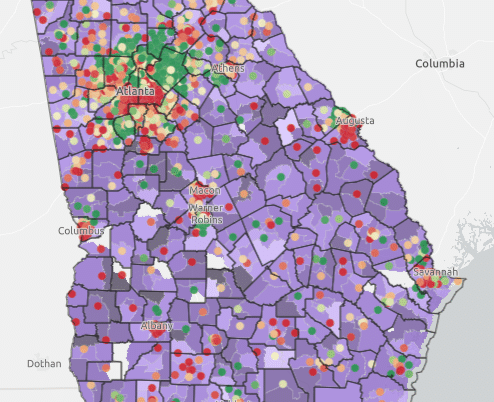
Readiness Radar: Access early care and education programs statewide; education, health, housing, economic, and demographic indicators at the neighborhood and county level; GEEARS Early Childhood Index for all Georgia census tracts; community profiles for cities, counties, and legislative districts; and early childhood education supply, demand, and gap analysis for five-county Metro Atlanta (Clayton, Cobb, DeKalb, Fulton, and Gwinnett) via the ATL ACCESS Map. This video overview will help new users learn their way around the tool. For more information about the work of our mapping partner, visit Neighborhood Nexus.
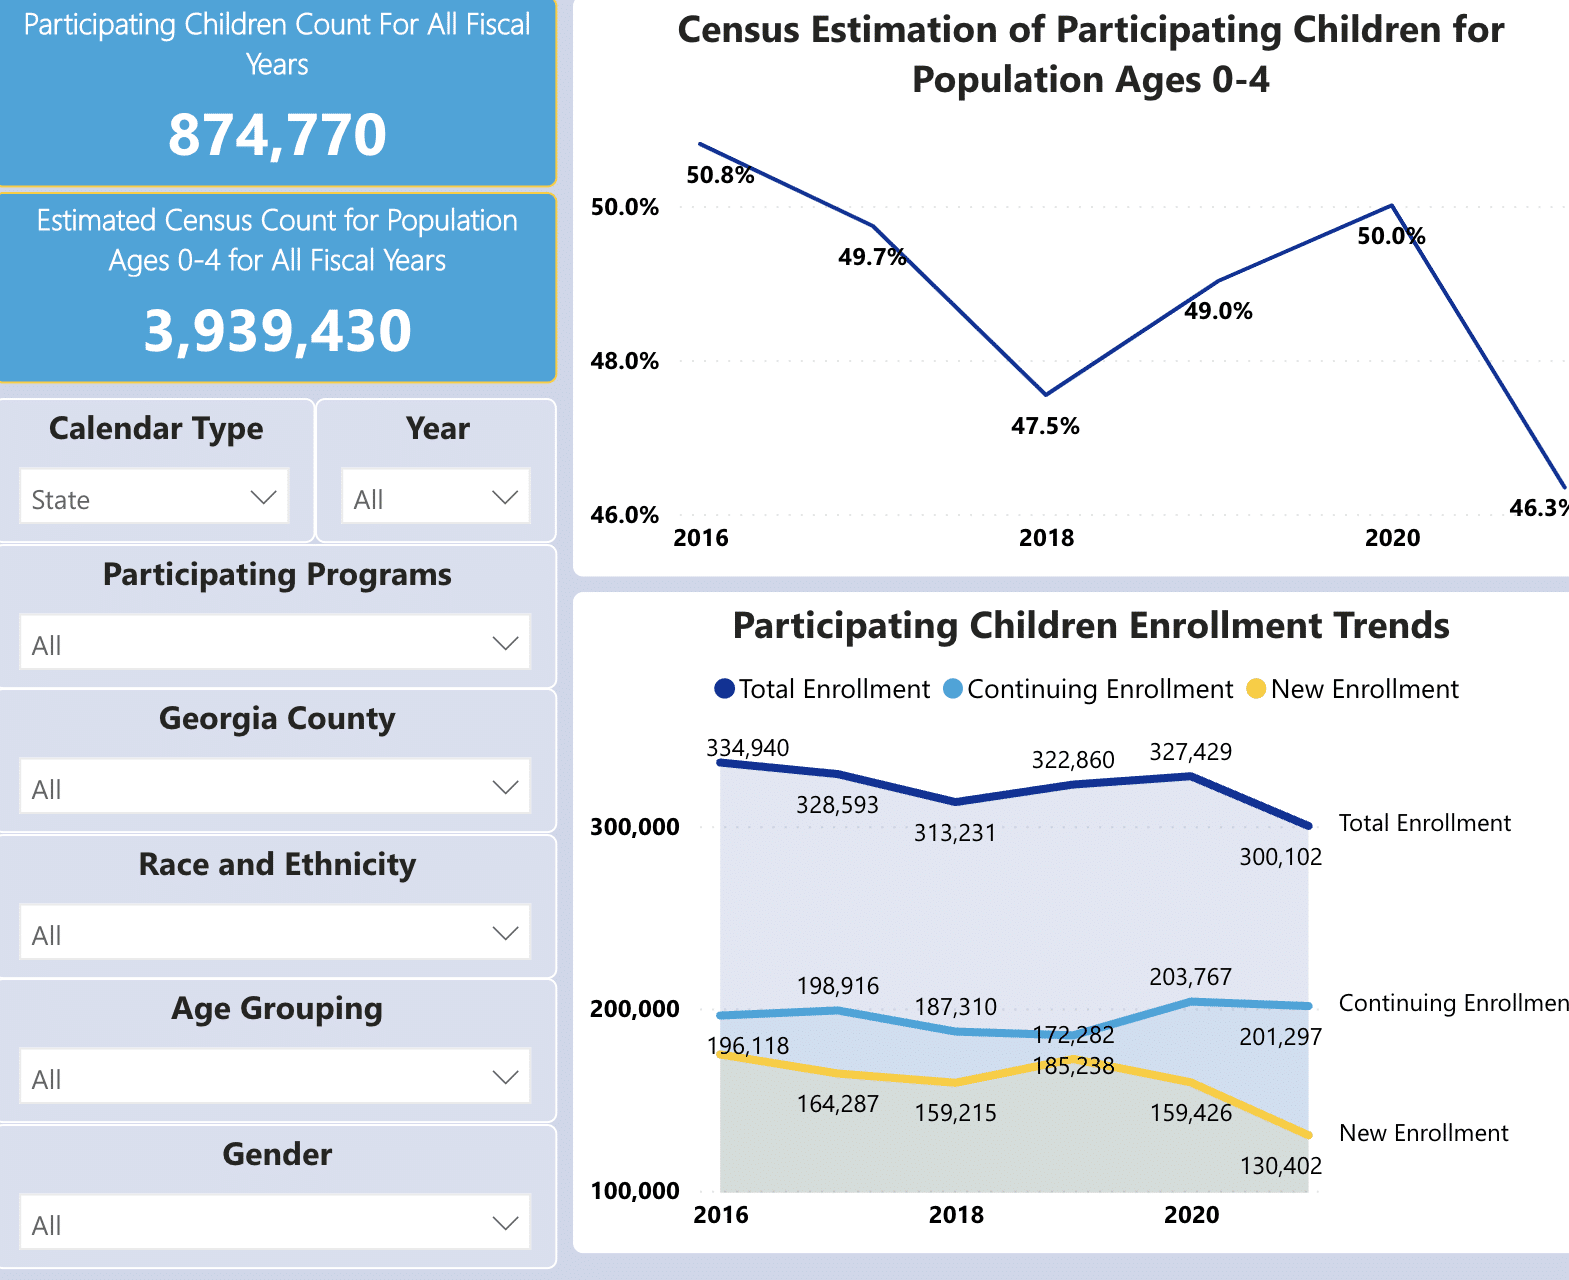
Georgia’s Cross Agency Child Data System (GA CACDS) Community Data Explorer: This tool summarizes program participation for children ages 0 – 5 enrolled in various early childhood services at the state- and county-level by race/ethnicity and gender.
Data Landscape Focus Tool: This easy-to-use tool focuses on key health and socioeconomic indicators that have shown to strongly influence student achievement as measured by third-grade reading, eighth-grade reading, and high school graduation rates.
Explore more by visiting these data tools developed by Campaign partners:
- GEEARS Readiness Radar: Explore data relevant to early childhood and school readiness. A county-level Blueprint tool illustrates multiple readiness indicators and assets, and a census-tract level Community Compass tool examines early childhood data at a more granular level. GEEARS has also developed Early Childhood County Profiles for all 159 counties, as well as an ATL ACCESS Map that depicts child care supply, demand, and gaps in Metro Atlanta.
- Georgia’s Cross Agency Child Data System (CACDS): GA CACDS aligns critical data from programs and services for children ages 0 – 5 and their families. The system identifies service gaps, creates opportunities for analysis and research, and provides an integrated and aligned approach to demonstrate how well the state is meeting the needs of its youngest learners. GA CACDS is the result of a partnership between the Georgia Department of Early Care and Learning, Georgia Department of Education, Georgia Department of Public Health, and Georgia Division of Family and Children Services.
- Georgia KIDS COUNT: Georgia Family Connection Partnership compiles current, reliable data on child well-being in each of our state’s 159 counties, reporting year-to-year data highlights, trends, and disparities to inform planning, budget, and policy decisions regarding priorities, services, and resources that impact Georgia’s children, families, and communities.
- Governor’s Office of Student Achievement (GOSA) Report Card and Georgia School Reports: The Report Card offers school-, system-, and state-level reports with detailed data on a wide range of student achievement and demographic indicators for every public school in the state. GOSA’s Georgia School Reports include A-F letter grades based on school performance, state test results, student body makeup, and graduation rate.
- Online Analytical Statistical Information System (OASIS): This suite of tools developed by the Georgia Department of Public Health includes tables, maps, and charts highlighting a variety of public health indicators that are sortable by population, disease, and survey characteristics.


